Yesterday, I explained the structure of an Impact Map. Let’s look at an example to understand better how to create an Impact Map.
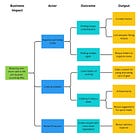
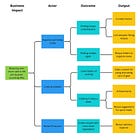
Here is a simple Impact Map for a fictional organization offering a recipe website.
An Impact Map should focus on one single Business Impact. This is a high-level organization goal. In this example, we want to focus on reducing user churn. Churn describes how many former active users have stopped using the service in a given time.
The goal is specific (reduce to 6%) and has a benchmark (currently at 8%). We must ensure the definition of when a user is counted as churned is clearly known by everybody.
The next level defines which Actors we want to focus on. We probably have more Actors than the ones named here. But while mapping, we can already limit the groups we know we should focus on. The focus on this Business Impact and these Actors usually comes out of our Product Strategy. We identified churn as a pressing problem and identified the user groups that are mostly responsible for the churn.
In this example, one of the user groups is Experienced Hobby Cooks – a group with high expectations looking for advanced features. The second group is Cooking Newbies – a user group that is very different from our first, mostly looking into getting into the habit of cooking. The third group is not a typical user group but our internal Recipe Producers who get supported by the technical teams to be able to create our content.
All groups have widely different needs. By all means, they are not generic users or customers but clear segments of our user base.
Additionally, I included the Recipe Producers to illustrate that not just user groups can be part of the Actors but also groups of people, external or internal, who influence the Business Impact.
We focus on what each group wants to do on the Outcome level. Looking at this, you already see that the needs vary widely between groups. The Outcomes describe clear behavior change for the specific user type. We can imagine that Finding Recipe Combinations is probably not very interesting for our Cooking Newbies. But we assume, and maybe already saw in User Research, that this is a task our Experienced Hobby Cooks struggle with and start looking for other solutions.
These Outcomes could also be defined with measurements. But at this point, I would abstain from going down this route. Discussions on clear metrics take time. Don’t waste this time in the beginning when defining your options.
The last level shows Output. What can the teams create to support the specific user group? We might have many more ideas on this level, as shown in this example, which is fine. We know that most people are good at coming up with ideas. The Impact Map helps you to have a first discussion of the validity of this idea. Does it really connect back to the Outcome for this Actor to influence the stated Business Goal?
For example, offering Curated Menus clearly helps our Experienced Hobby Cooks find recipe combinations, and we assume they won’t leave for another service when this need is catered for.
As you see, an Impact Map helps you get an overview of everything you could do to achieve a given Business Impact. In my experience, this is a great way to connect leadership and product teams without focusing the discussion on solutions.
In a following post, I will dive deeper into taking the next steps to focus on single solutions.


